Chapter 11 Excel file and dataset details
11.1 Introduction
This chapter is included to document recent Excel file format changes and the new dataset structure.
11.2 ROC dataset
x <- DfReadDataFile("R/quick-start/rocCr.xlsx", newExcelFileFormat = TRUE)11.2.1 The structure of a factorial ROC dataset object
x is a list with 3 members: ratings, lesions and descriptions.
str(x, max.level = 1)
#> List of 3
#>  $ ratings     :List of 3
#>  $ lesions     :List of 3
#>  $ descriptions:List of 7
The x$ratings member contains 3 sub-lists.
str(x$ratings)
#> List of 3
#>  $ NL   : num [1:2, 1:5, 1:8, 1] 1 3 2 3 2 2 1 2 3 2 ...
#>  $ LL   : num [1:2, 1:5, 1:5, 1] 5 5 5 5 5 5 5 5 5 5 ...
#> $ LL_IL: logi NAx$ratings$NL, with dimension [2, 5, 8, 1], contains the ratings of normal cases. The first dimension (2) is the number of treatments, the second (5) is the number of readers and the third (8) is the total number of cases. For ROC datasets the fourth dimension is always unity. The five extra values 3 in the third dimension, ofx$ratings$NLwhich are filled withNAs, are needed for compatibility with FROC datasets.x$ratings$LL, with dimension [2, 5, 5, 1], contains the ratings of abnormal cases. The third dimension (5) corresponds to the 5 diseased cases.x$ratings$LL_IL, equal to NA’, is there for compatibility with LROC data,ILdenotes incorrect-localizations.
The x$lesions member contains 3 sub-lists.
str(x$lesions)
#> List of 3
#>  $ perCase: int [1:5] 1 1 1 1 1
#>  $ IDs    : num [1:5, 1] 1 1 1 1 1
#>  $ weights: num [1:5, 1] 1 1 1 1 1
The
x$lesions$perCasemember is a vector with 5 ones representing the 5 diseased cases in the dataset.The
x$lesions$IDsmember is an array with 5 ones.
x$lesions$weights
#>      [,1]
#> [1,]    1
#> [2,]    1
#> [3,]    1
#> [4,]    1
#> [5,]    1
x$lesions$weights member is an array with 5 ones. These are irrelevant for ROC datasets. They are there for compatibility with FROC datasets.
x$descriptions contains 7 sub-lists.
str(x$descriptions)
#> List of 7
#>  $ fileName     : chr "rocCr"
#>  $ type         : chr "ROC"
#>  $ name         : logi NA
#>  $ truthTableStr: num [1:2, 1:5, 1:8, 1:2] 1 1 1 1 1 1 1 1 1 1 ...
#>  $ design       : chr "FCTRL"
#>  $ modalityID   : Named chr [1:2] "0" "1"
#>   ..- attr(*, "names")= chr [1:2] "0" "1"
#>  $ readerID     : Named chr [1:5] "0" "1" "2" "3" ...
#> ..- attr(*, "names")= chr [1:5] "0" "1" "2" "3" ...x$descriptions$fileNameis intended for internal use.x$descriptions$typeindicates that this is anROCdataset.x$descriptions$nameis intended for internal use.x$descriptions$truthTableStris intended for internal use, see Section 11.3.2.x$descriptions$designspecifies the dataset design, which is “FCTRL” in the present example (“FCTRL” = a factorial dataset).x$descriptions$modalityIDis a vector with two elements"0"and"1", the names of the two modalities.x$readerIDis a vector with five elements"0","1","2","3"and"4", the names of the five readers.
11.2.2 The FP worksheet
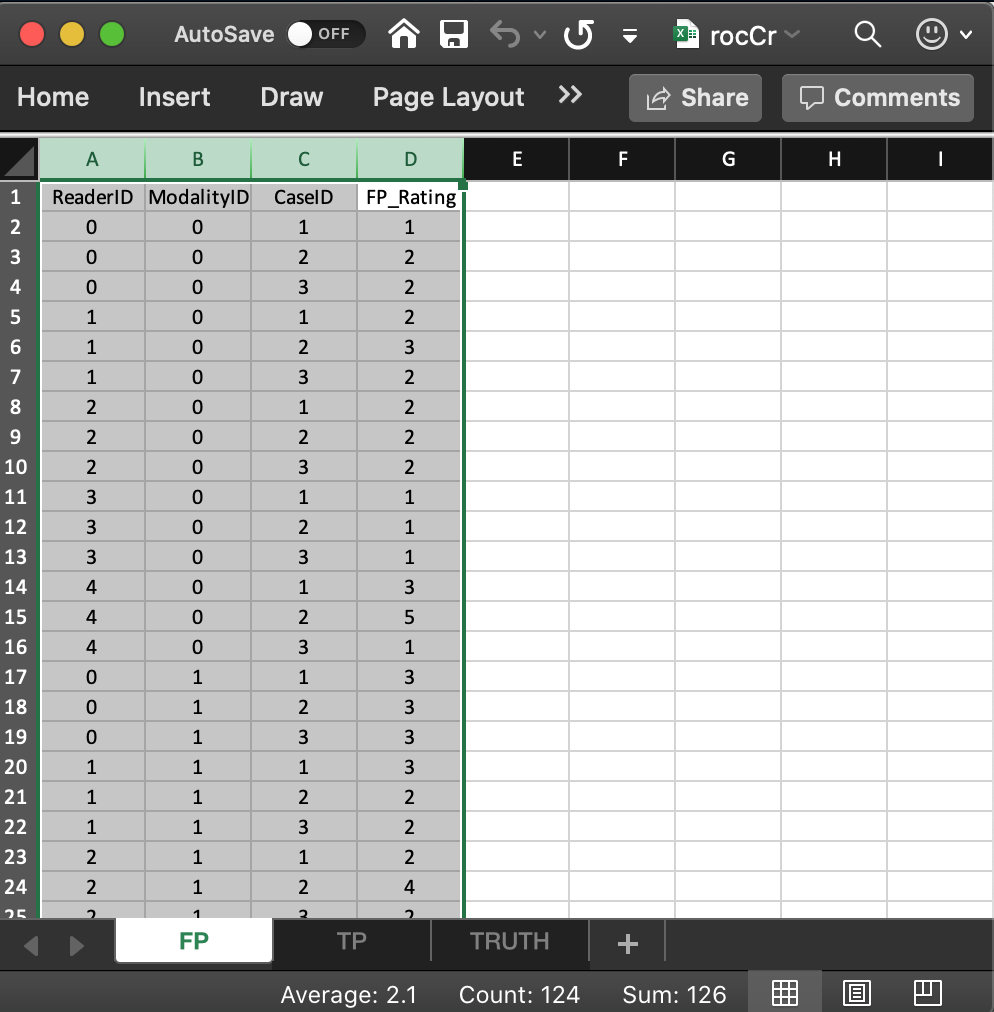
- The list member
x$ratings$NLis an array withdim = c(2,5,8,1).- The first dimension (2) comes from the number of modalities.
- The second dimension (5) comes from the number of readers.
- The third dimension (8) comes from the total number of cases.
- The fourth dimension is always 1 for an ROC dataset.
- The value of
x$ratings$NL[1,5,2,1], i.e., 5, corresponds to row 15 of the FP table, i.e., toModalityID= 0,ReaderID= 4 andCaseID= 2. - The value of
x$ratings$NL[2,3,2,1], i.e., 4, corresponds to row 24 of the FP table, i.e., toModalityID1,ReaderID2 andCaseID2. - All values for case index > 3 and case index <= 8 are
-Inf. For example the value ofx$ratings$NL[2,3,4,1]is-Inf. This is because there are only 3 non-diseased cases. The extra length is needed for compatibility with FROC datasets.
11.2.3 The TP worksheet
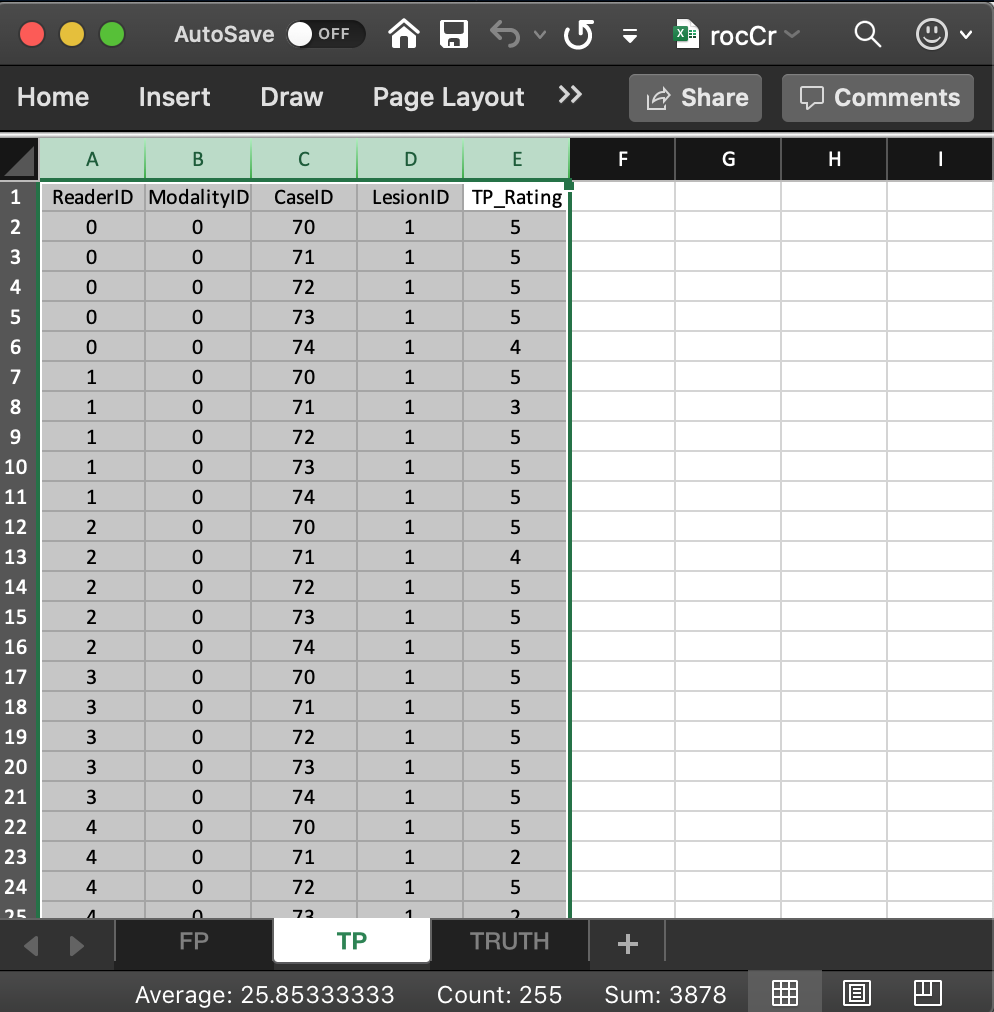
- The list member
x$ratings$LLis an array withdim = c(2,5,5,1).- The first dimension (2) comes from the number of modalities.
- The second dimension (5) comes from the number of readers.
- The third dimension (5) comes from the number of diseased cases.
- The fourth dimension is always 1 for an ROC dataset.
- The value of
x$ratings$LL[1,1,5,1], i.e., 4, corresponds to row 6 of the TP table, i.e., toModalityID= 0,ReaderID= 0 andCaseID= 74. - The value of
x$ratings$LL[1,2,2,1], i.e., 3, corresponds to row 8 of the TP table, i.e., toModalityID= 0,ReaderID= 1 andCaseID= 71. - The value of
x$ratings$LL[1,4,4,1], i.e., 5, corresponds to row 21 of the TP table, i.e., toModalityID= 0,ReaderID= 3 andCaseID= 74. - The value of
x$ratings$LL[1,5,2,1], i.e., 2, corresponds to row 23 of the TP table, i.e., toModalityID= 0,ReaderID= 4 andCaseID= 71. - There are no
-Infvalues inx$ratings$LL:any(x$ratings$LL == -Inf)= FALSE. This is true for any ROC dataset.
11.2.4 caseIndex vs. caseID
- The
caseIndexis the array index used to access elements in the NL and LL arrays. The case-index is always an integer in the range 1, 2, …, up to the array length. Remember that unlike C++, R indexing starts from 1. - The
caseIDis any integer value, including zero, used to uniquely label the cases. - Regardless of what order they occur in the worksheet, the non-diseased cases are always ordered first. In the current example the case indices are 1, 2 and 3, corresponding to the three non-diseased cases with
caseIDsequal to 1, 2 and 3. - Regardless of what order they occur in the worksheet, in the NL array the diseased cases are always ordered after the last non-diseased case. In the current example the case indices in the
NLarray are 4, 5, 6, 7 and 8, corresponding to the five diseased cases withcaseIDsequal to 70, 71, 72, 73, and 74. In theLLarray they are indexed 1, 2, 3, 4 and 5. Some examples follow: x$ratings$NL[1,3,2,1], a FP rating, refers toModalityID0,ReaderID2 andCaseID2 (since the modality and reader IDs start with 0).x$ratings$NL[2,5,4,1], a FP rating, refers toModalityID1,ReaderID4 andCaseID70, the first diseased case; this is-Inf.x$ratings$NL[1,4,8,1], a FP rating, refers toModalityID0,ReaderID3 andCaseID74, the last diseased case; this is-Inf.x$ratings$NL[1,3,9,1], a FP rating, is an illegal value, as the third index cannot exceed 8.x$ratings$NL[1,3,8,2], a FP rating, is an illegal value, as the fourth index cannot exceed 1 for an ROC dataset.x$ratings$LL[1,3,1,1], a TP rating, refers toModalityID0,ReaderID2 andCaseID70, the first diseased case.x$ratings$LL[2,5,4,1], a TP rating, refers toModalityID1,ReaderID4 andCaseID73, the fourth diseased case.
11.3 FROC dataset
11.3.1 The structure of a factorial FROC dataset
x <- DfReadDataFile("images/software-details/frocCr.xlsx", newExcelFileFormat = TRUE)The dataset x is a list variable with 3 members: x$ratings, x$lesions and x$descriptions.
str(x, max.level = 1)
#> List of 3
#>  $ ratings     :List of 3
#>  $ lesions     :List of 3
#>  $ descriptions:List of 7
The x$ratings member contains 3 sub-lists.
str(x$ratings)
#> List of 3
#>  $ NL   : num [1:2, 1:3, 1:8, 1:2] 1.02 2.89 2.21 3.01 2.14 ...
#>  $ LL   : num [1:2, 1:3, 1:5, 1:3] 5.28 5.2 5.14 4.77 4.66 4.87 3.01 3.27 3.31 3.19 ...
#> $ LL_IL: logi NA- There are
K2 = 5diseased cases (the length of the third dimension ofx$ratings$LL) andK1 = 3non-diseased cases (the length of the third dimension ofx$ratings$NLminusK2). x$ratings$NL, a [2, 3, 8, 2] array, contains the NL ratings on non-diseased and diseased cases.x$ratings$LL, a [2, 3, 5, 3] array, contains the ratings of LLs on diseased cases.x$ratings$LL_ILisNA, this field applies to an LROC dataset (contains incorrect localizations on diseased cases).
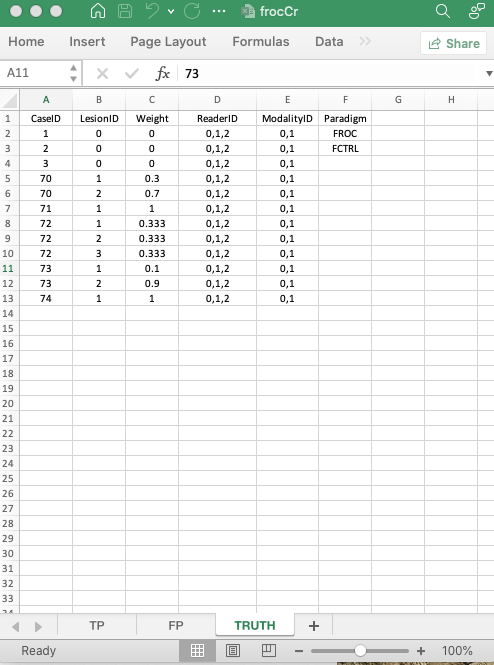
The x$lesions member contains 3 sub-lists.
str(x$lesions)
#> List of 3
#>  $ perCase: int [1:5] 2 1 3 2 1
#>  $ IDs    : num [1:5, 1:3] 1 1 1 1 1 ...
#> $ weights: num [1:5, 1:3] 0.3 1 0.333 0.1 1 ...x$lesions$perCaseis the number of lesions per diseased case vector, i.e., 2, 1, 3, 2, 1.max(x$lesions$perCase)is the maximum number of lesions per case, i.e.,rmax(x\(lesions\)perCase)`.x$lesions$weightsis the weights of lesions.
x$lesions$weights
#>           [,1]      [,2]      [,3]
#> [1,] 0.3000000 0.7000000      -Inf
#> [2,] 1.0000000      -Inf      -Inf
#> [3,] 0.3333333 0.3333333 0.3333333
#> [4,] 0.1000000 0.9000000      -Inf
#> [5,] 1.0000000      -Inf      -Inf
The weights for the first diseased case are 0.3 and 0.7. The weight for the second diseased case is 1. For the third diseased case the three weights are 1/3 each, etc. For each diseased case the finite weights sum to unity.
x$descriptions contains 7 sub-lists.
str(x$descriptions)
#> List of 7
#>  $ fileName     : chr "frocCr"
#>  $ type         : chr "FROC"
#>  $ name         : logi NA
#>  $ truthTableStr: num [1:2, 1:3, 1:8, 1:4] 1 1 1 1 1 1 1 1 1 1 ...
#>  $ design       : chr "FCTRL"
#>  $ modalityID   : Named chr [1:2] "0" "1"
#>   ..- attr(*, "names")= chr [1:2] "0" "1"
#>  $ readerID     : Named chr [1:3] "0" "1" "2"
#> ..- attr(*, "names")= chr [1:3] "0" "1" "2"x$descriptions$filenameis for internal use.x$descriptions$typeis FROC, which specifies the data collection method.x$descriptions$nameis for internal use.x$descriptions$truthTableStris for internal use; it quantifies the structure of the dataset; it is explained in the next section.x$descriptions$designis FCTRL; it specifies the study design.x$descriptions$modalityIDis a vector with two elements 0, 1 naming the two modalities.x$readerIDis a vector with three elements 0, 1, 2 naming the three readers.
11.3.2 truthTableStr
- For this dataset
I= 2,J= 3 andK= 8. truthTableStris a2 x 3 x 8 x 4array, i.e.,IxJxKx (maximum number of lesions per case plus 1 - theplus 1is needed to accommodate non-diseased cases).- Each entry in this array is either
1, meaning the corresponding interpretation happened, orNA, meaning the corresponding interpretation did not happen.
11.3.2.1 Explanation for non-diseased cases
Since the fourth index is set to 1, in the following code only non-diseased cases yield ones and all diseased cases yield NA.
all(x$descriptions$truthTableStr[,,1:3,1] ==1)
#> [1] TRUE
all(is.na(x$descriptions$truthTableStr[,,4:8,1]))
#> [1] TRUE
11.3.2.2 Explanation for diseased cases with one lesion
Since the fourth index is set to 2, in the following code all non-diseased cases yield NA and all diseased cases yield 1 as all diseased cases have at least one lesion.
all(is.na(x$descriptions$truthTableStr[,,1:3,2]))
#> [1] TRUE
all(x$descriptions$truthTableStr[,,4:8,2] == 1)
#> [1] TRUE
11.3.2.3 Explanation for diseased cases with two lesions
Since the fourth index is set to 3, in the following code all non-diseased cases yield NA; the first diseased case 70 yields 1 (this case contains two lesions); the second disease case 71 yields NA (this case contains only one lesion); the third disease case 72 yields NA (this case contains only two lesions); the fourth disease case 73 yields 1 (this case contains two lesions); the fifth disease case 74 yields NA (this case contains one lesion).
# all non diseased cases
all(is.na(x$descriptions$truthTableStr[,,1:3,3]))
#> [1] TRUE
# first diseased case
all(x$descriptions$truthTableStr[,,4,3] == 1)
#> [1] TRUE
# second diseased case
all(is.na(x$descriptions$truthTableStr[,,5,3]))
#> [1] TRUE
# third diseased case
all(x$descriptions$truthTableStr[,,6,3] == 1)
#> [1] TRUE
# fourth diseased case
all(x$descriptions$truthTableStr[,,7,3] == 1)
#> [1] TRUE
# fifth diseased case
all(is.na(x$descriptions$truthTableStr[,,8,3]))
#> [1] TRUE
11.3.2.4 Explanation for diseased cases with three lesions
Since the fourth index is set to 4, in the following code all non-diseased cases yield NA; the first diseased case 70 yields NA (this case contains two lesions); the second disease case 71 yields NA (this case contains one lesion); the third disease case 72 yields NA (this case contains two lesions); the fourth disease case 73 yields 1 (this case contains three lesions); the fifth disease case 74 yields NA (this case contains one lesion).
# all non diseased cases
all(is.na(x$descriptions$truthTableStr[,,1:3,4]))
#> [1] TRUE
# first diseased case
all(is.na(x$descriptions$truthTableStr[,,4,4]))
#> [1] TRUE
# second diseased case
all(is.na(x$descriptions$truthTableStr[,,5,4]))
#> [1] TRUE
# third diseased case
all(x$descriptions$truthTableStr[,,6,4] == 1)
#> [1] TRUE
# fourth diseased case
all(is.na(x$descriptions$truthTableStr[,,7,4]))
#> [1] TRUE
# fifth diseased case
all(is.na(x$descriptions$truthTableStr[,,8,4]))
#> [1] TRUE
11.3.3 The FP worksheet
These are found in the FP or NL worksheet:
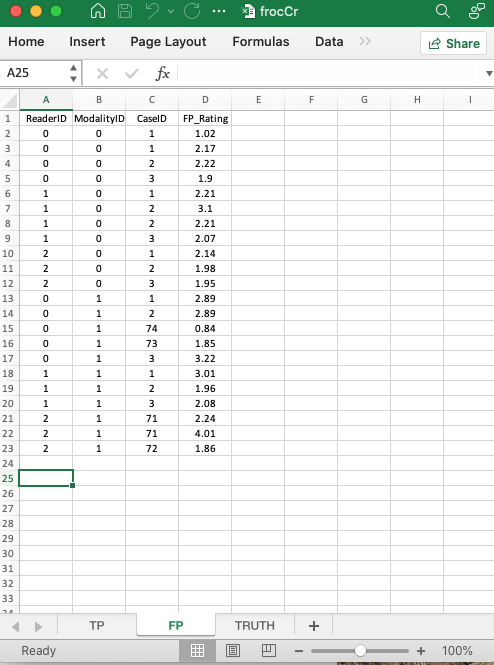
- The common vertical length is 22 in this example.
ReaderID: the reader labels:0, 1,2, as declared in theTruth` worksheet.ModalityID: the modality labels:0or1, as declared in theTruthworksheet.CaseID:1,2,3,71,72,73,74, as declared in theTruthworksheet; note that not all cases have NL marks on them.
NL_Rating: the ratings of non-diseased cases.
11.3.4 The TP worksheet
These are found in the TP or LL worksheet, see below.
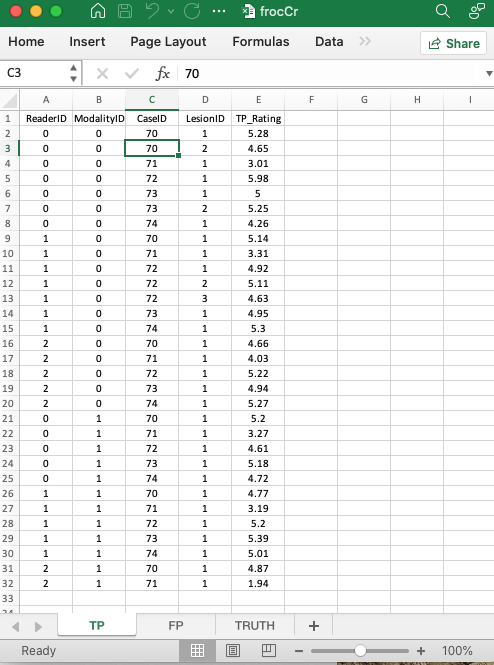
- This worksheet has the ratings of diseased cases.
ReaderID: the reader labels: these must be from0,1,2, as declared in theTruthworksheet.ModalityID:0or1, as declared in theTruthworksheet.CaseID: these must be from70,71,72,73,74, as declared in theTruthworksheet; not all diseased cases have LL marks.
LL_Rating: the ratings of diseased cases.
With only 3 non-diseased cases why does one need 8 values?↩︎