Chapter 2 JAFROC data format
2.1 TBA How much finished
80% (need to add images for one reader; add one-modality dataset)
2.2 Introduction
- JAFROC data format is named after the file format adopted circa. 2006 for the input Excel file to Windows JAFROC software.
- The purpose of this chapter is to explain the data format of this file.
- Reading this file into a dataset object suitable for
RJafrocanalysis is the subject of the next chapter. - Background on observer performance methods are in my book (Chakraborty 2017).
- I will start with Receiver Operating Characteristic (ROC) data (Metz 1978) as this is by far the simplest paradigm.
- In the ROC paradigm the observer assigns a rating to each image. A rating is an ordered numeric label, and, in our convention, higher values represent greater certainty or confidence level for presence of disease. With human observers, a 5 (or 6) point rating scale is typically used, with 1 representing highest confidence for absence of disease and 5 (or 6) representing highest confidence for presence of disease. Intermediate values represent intermediate confidence levels for presence or absence of disease.
- Note that location information, if applicable, associated with the disease, is not collected.
- There is no restriction to 5 or 6 ratings. With algorithmic observers, e.g., computer aided detection (CAD) algorithms, the rating could be a floating point number and have infinite precision. All that is required is that higher values correspond to greater confidence in presence of disease.
- The above is termed a positive-directed rating scale. If lower numbers correspond to greater confidence, termed a negative-directed rating scale, a simple transformation to \(max(rating) - rating + 1\), where \(max(rating)\) is the maximum rating, over all readers, modalities and cases, will convert a negative-directed rating scale to a positive directed rating scale.
2.3 Note to existing users
- The Excel file format has recently undergone changes, involving three additional columns in the
Truthworksheet. RJafrocwill work with old format Excel files as the additional columns are ignored.- Reasons for the change will become clearer in later chapters.1
2.4 Contents of Excel file
- The illustrations in this chapter correspond to Excel file
R/quick-start/rocCr.xlsxin the project directory.2 This is a toy file, i.e., an artificial small dataset intended to illustrate essential features of the data format. - The Excel file has three worksheets:
Truth,NL(orFP) andLL(orTP).
2.5 The Truth worksheet
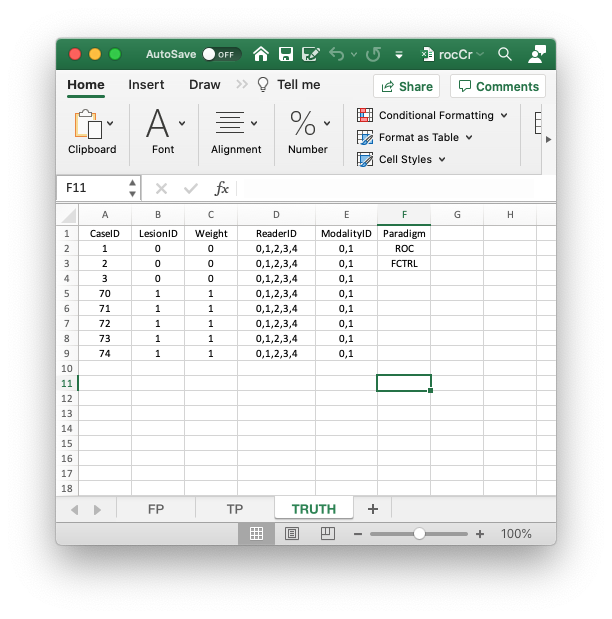
- The
Truthworksheet contains 6 columns:CaseID,LesionID,Weight,ReaderID,ModalityIDandParadigm. - The first five columns contain as many rows as there are cases (images) in the dataset.
CaseID: unique integers, one per case, representing the cases in the dataset.LesionID: integers 0 or 1, with each 0 representing a non-diseased case and each 1 representing a diseased case.- In the current dataset, the non-diseased cases are labeled
1,2and3, while the diseased cases are labeled70,71,72,73and74. The values do not have to be consecutive integers; they need not be ordered; the only requirement is that they be unique integers. Weight: A floating point value, typically filled in with 0 or 1; this field is not used for ROC data.ReaderID: a comma-separated listing of reader labels, each represented by a unique integer, that have interpreted the case. In the example shown below each cell has the value0, 1, 2, 3, 4meaning that each of these readers has interpreted all cases (hence the “factorial” design).- With multiple readers each cell in this column has to be text formatted as otherwise Excel will not accept it.
- Select the worksheet, then
Format-Cells-Number-Text-OK.
ModalityID: a comma-separated listing of modalities, each represented by a unique integer, that are applied to each case. In the example each cell has the value0, 1.- With multiple modalities each cell has to be text formatted as otherwise Excel will not accept it.
- Format the cells as described above.
Paradigm: this column contains two cells,ROCandfactorial. It informs the software that this is an ROC dataset, and the design is factorial, meaning each reader has interpreted each case in each modality.- There are 5 diseased cases in the dataset (the number of 1’s in the
LesionIDcolumn of theTruthworksheet). - There are 3 non-diseased cases in the dataset (the number of 0’s in the
LesionIDcolumn). - There are 5 readers in the dataset (each cell in the
ReaderIDcolumn contains the string0, 1, 2, 3, 4). - There are 2 modalities in the dataset (each cell in the
ModalityIDcolumn contains the string0, 1).
2.6 The false positive (FP) ratings
These are found in the FP or NL worksheet, see below.
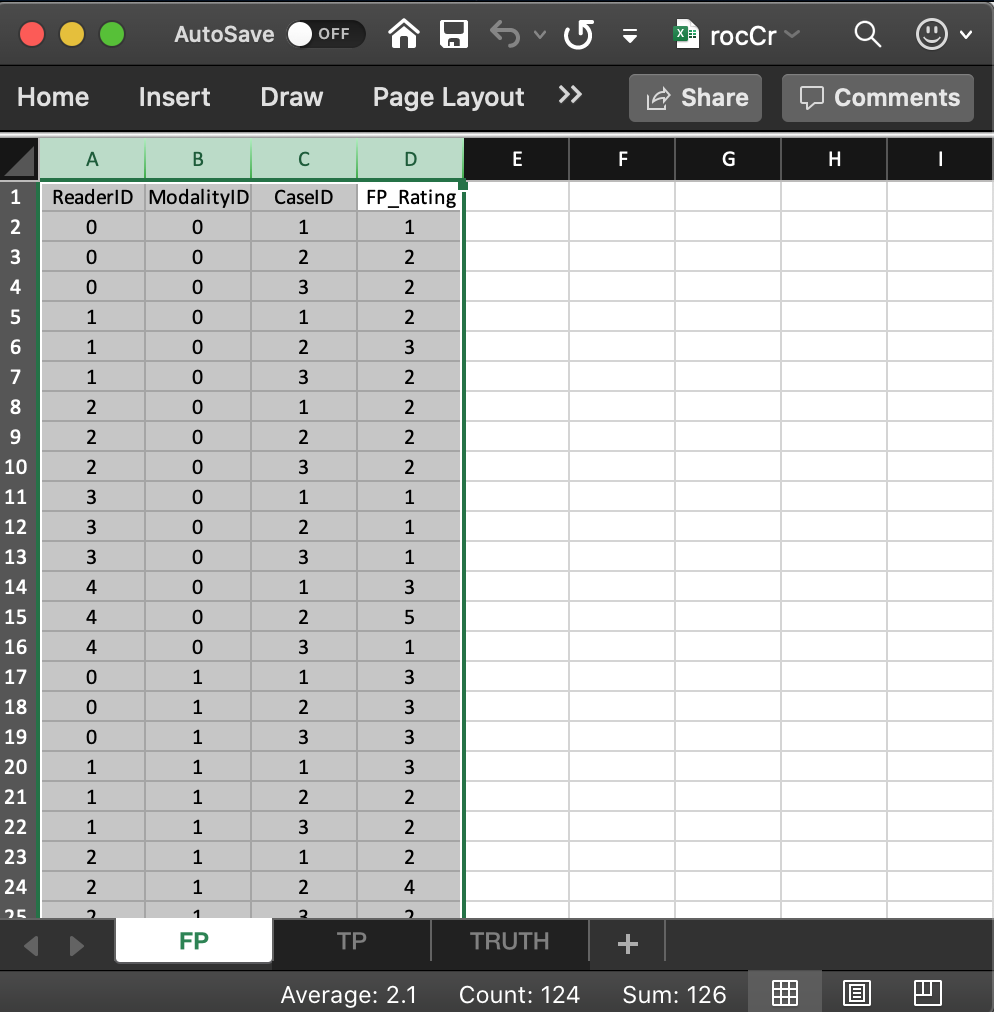
- It consists of 4 columns, each of length 30 (# of modalities X number of readers X number of non-diseased cases).
ReaderID: the reader labels:0,1,2,3and4. Each reader label occurs 6 times (# of modalities X number of non-diseased cases).ModalityID: the modality or treatment labels:0and1. Each label occurs 15 times (# of readers X number of non-diseased cases).CaseID: the case labels for non-diseased cases:1,2and3. Each label occurs 10 times (# of modalities X # of readers).- The label of a diseased case cannot occur in the FP worksheet. If it does the software generates an error.
FP_Rating: the floating point ratings of non-diseased cases. Each row of this worksheet contains a rating corresponding to the values ofReaderID,ModalityIDandCaseIDfor that row.
2.7 The true positive (TP) ratings
These are found in the TP or LL worksheet, see below.
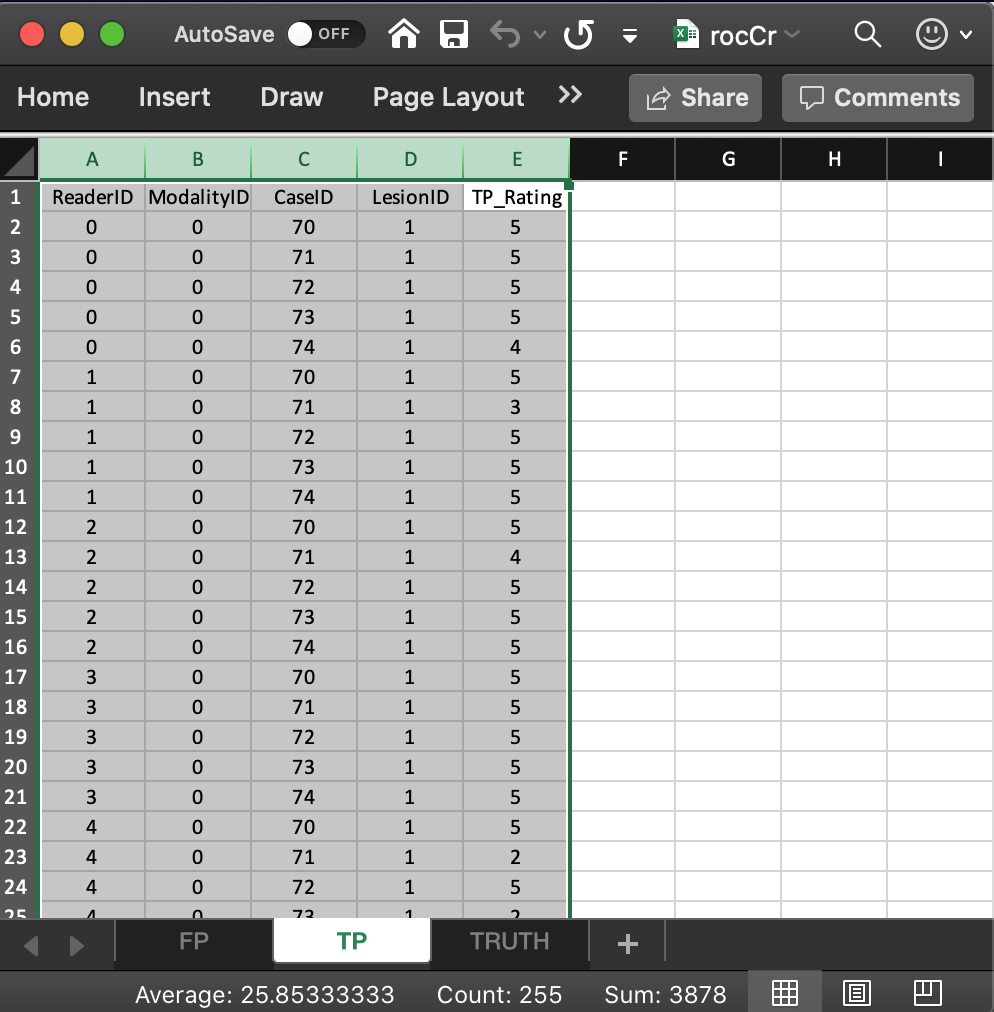
- It consists of 5 columns, each of length 50 (# of modalities X number of readers X number of diseased cases).
ReaderID: the reader labels:0,1,2,3and4. Each reader label occurs 10 times (# of modalities X number of diseased cases).ModalityID: the modality or treatment labels:0and1. Each label occurs 25 times (# of readers X number of diseased cases).LesionID: For an ROC dataset this column contains fifty 1’s (each diseased case has one lesion).CaseID: the case labels for non-diseased cases:70,71,72,73and74. Each label occurs 10 times (# of modalities X # of readers). For an ROC dataset the label of a non-diseased case cannot occur in the TP worksheet. If it does the software generates an error.TP_Rating: the floating point ratings of diseased cases. Each row of this worksheet contains a rating corresponding to the values ofReaderID,ModalityID,LesionIDandCaseIDfor that row.
2.8 A single reader dataset
rocCr1R <- "R/quick-start/rocCr1R.xlsx"
x <- DfReadDataFile(rocCr1R, newExcelFileFormat = TRUE)
str(x)
#> List of 3
#>  $ ratings     :List of 3
#>   ..$ NL   : num [1:2, 1, 1:8, 1] 2 3 3 2 2 ...
#>   ..$ LL   : num [1:2, 1, 1:5, 1] 5 5 3 3 5 5 5 5 5 5
#>   ..$ LL_IL: logi NA
#>  $ lesions     :List of 3
#>   ..$ perCase: int [1:5] 1 1 1 1 1
#>   ..$ IDs    : num [1:5, 1] 1 1 1 1 1
#>   ..$ weights: num [1:5, 1] 1 1 1 1 1
#>  $ descriptions:List of 7
#>   ..$ fileName     : chr "rocCr1R"
#>   ..$ type         : chr "ROC"
#>   ..$ name         : logi NA
#>   ..$ truthTableStr: num [1:2, 1, 1:8, 1:2] 1 1 1 1 1 1 NA NA NA NA ...
#>   ..$ design       : chr "FCTRL"
#>   ..$ modalityID   : Named chr [1:2] "0" "1"
#>   .. ..- attr(*, "names")= chr [1:2] "0" "1"
#>   ..$ readerID     : Named chr "1"
#>   .. ..- attr(*, "names")= chr "1"
2.9 References
References
Chakraborty, Dev P. 2017. Observer Performance Methods for Diagnostic Imaging: Foundations, Modeling, and Applications with R-Based Examples. Boca Raton, FL: CRC Press.
Metz, C. E. 1978. “Basic Principles of ROC Analysis.” Journal Article. Seminars in Nuclear Medicine 8 (4): 283–98. https://doi.org/10.1016/s0001-2998(78)80014-2.